One point is a statement. Two points are a sentence. Three build a theory. Four make a set. And five form a network. These diagrams illustrate how seeing a constellation of connections can prompt your mind to see relationships between not just singular ideas, but between sets of ideas.
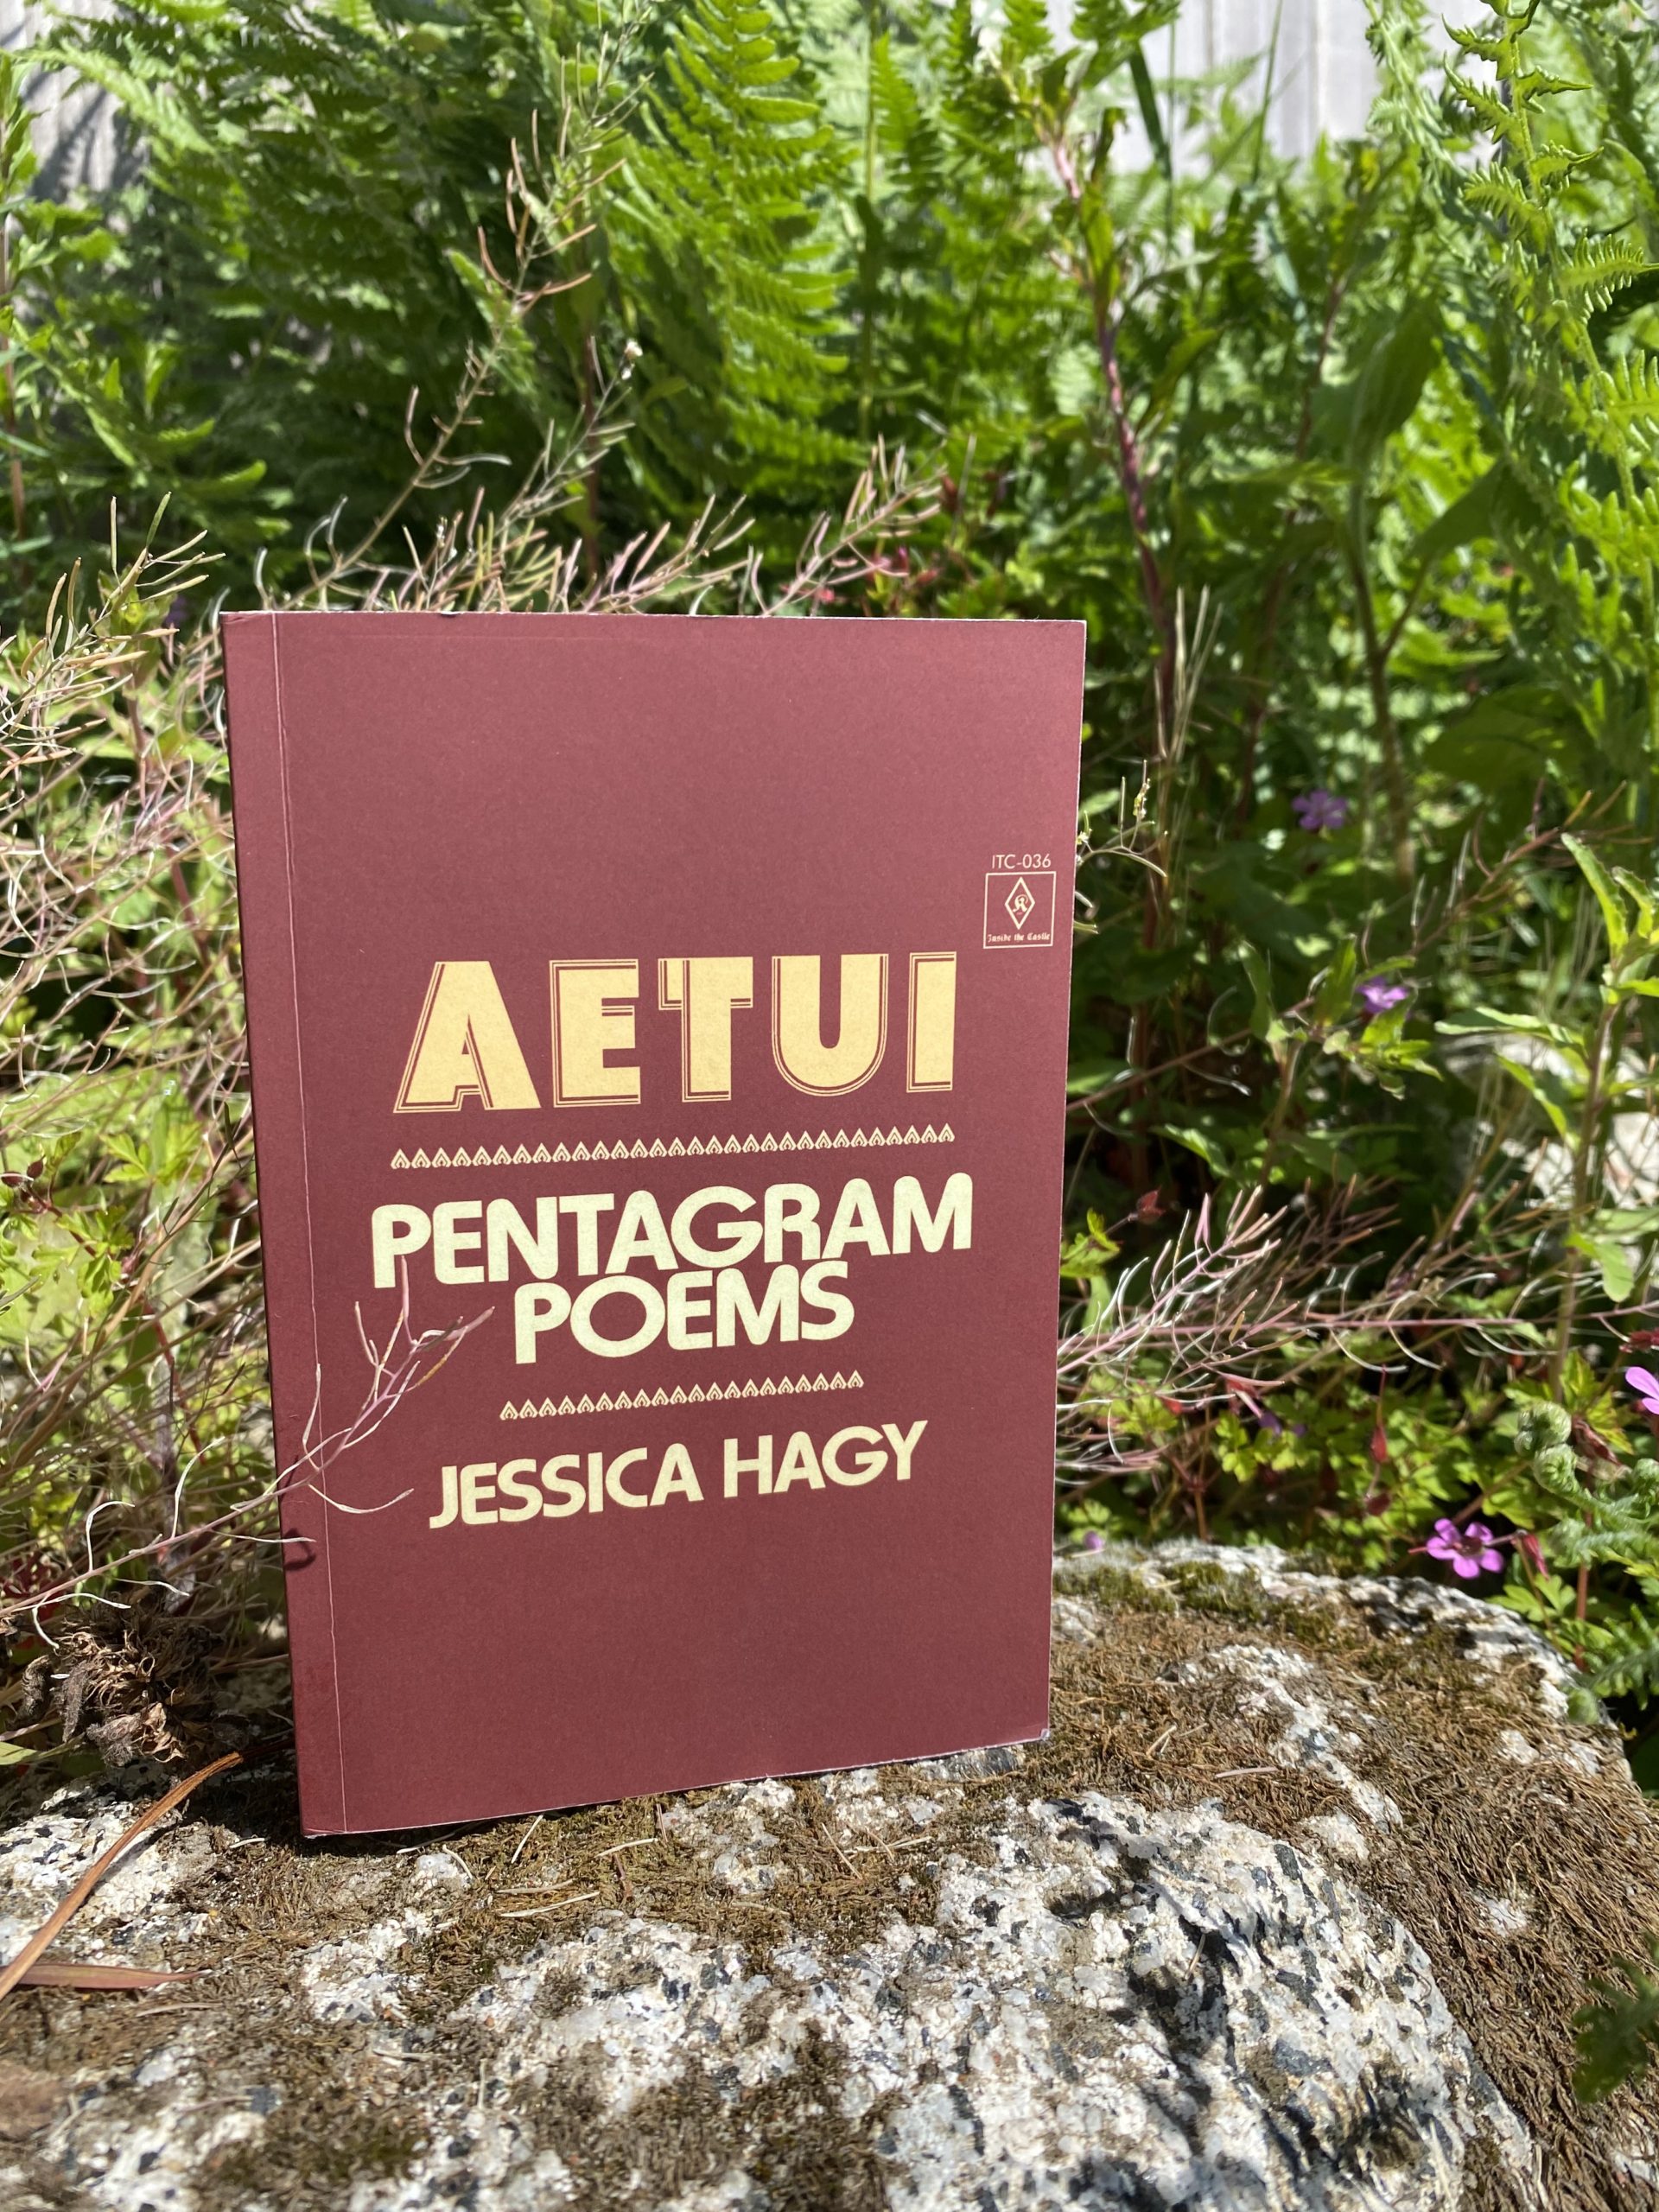
This poetic exploration of data visualization has been collected and published in book form by Inside the Castle Press.
As helpfully explained in this review: “It’s all very simple and clear on the surface, and easily lures the eyeball in. This is where Hagy’s book gets tricky. Her decisions about what to make of these interrelationships between words are marked with enough playful wit and invention that quickly the reader’s circuitry can become overwhelmed. But it’s a pleasant kind of overwhelmed that in some ways may be meant to echo, on the page, the sensation of data-intake we in 2022 have as we negotiate graphs, menus, cascades of advertisements, and other visual interfaces online. The pentagram diagrams, warped and torqued out of whack (using the book as a flip book is fun, you get to watch the pentagram flail about on the page like an electrified starfish), are there to serve as a visual focus, a “locking-on” point for your mind to conceive of the five interrelated listings. The suggestion of arcane magical spells is implied by the ubiquitous five-pointed star. The frothy, accessible simplicity of the book’s design, almost for design’s sake, sets AETUI among the most coveted art-book-objects that have come out in recent years from Inside the Castle, a painfully cool small press in Lawrence, Kansas “specializing in works of literature from the ‘expanded field.’” Imagine a literate bathroom humor book designed by Edward R. Tufte, author of The Visual Display of Quantitative Information, with a dash of satanic panic provocation added for countercultural spice.”


